AUTOCORR - Spatial autocorrelation
| Index | ||
|---|---|---|
| Single Raster Analysis
Tools VII AUTOCORR - Spatial autocorrelation |
A-Z | Palettes and Symbol Files |
You've all heard about fuzzy logic? It's a nice hot term, perhaps a bit outdated already. Meanwhile you might have met fuzzy logic cameras, camcorders and washing machines. "Fuzzy" also means something not being very clear, not being sharply defined.
Fuzzy logic! What a paradox, isn't it? "Logic" sounds much like a counterpart to fuzzy.
Maybe you have already found the FUZZY routine in the IDRISI software and played around with it. Did it help you solving your problems? Yes?? Well - stop reading now and go on with the next part.
Fuzzy denotes a thing or a status that cannot be defined very sharply. E. g., ask 100 persons, by what range of ages they would define a "young person" - you might receive answers starting from a newborn, others starting from 3 years, and so on. Maybe somebody would set the upper limit to 40. For sure you would get some overlapping range, where all agreed, e. g., humans at ages from 5 to 25.
Now, what should we take for true? Would you feel happy with a very deliberately statement such as: "young persons are human beings from the age of 0 up to 40"? Or should we better take the range of ages everybody agreed with - 5 to 25?
In either cases we do have a feeling, there's something wrong about. So what should we do?
Fuzzy logic can help us out, in that we do not set sharp, crisp bounds, where young persons immediately turn into medium or old ones. We put all the judgements into a group called "membershipset of young persons", those starting with 0 and the ones ending up with 40 years. But they all do have different strenghts of memberships, those within the all agreed range of 5 to 25 have a full membership, so let's give them a value of 1. Nobody extended the range beyond 40, so ages beyond 40 will receive a membership of 0 (sorry). That was easy, wasn't it? But now on to all the persons between these extremes - the perfect members, which are our overall accepted "young persons" and the guy at the age of 40? As you realized, we now do have two values, 0 and 1. Ha! Simply we give those between 25 and 40 also values between 1 and 0. We perform a remapping of the real ages to values within the range of [0, 1]. The way we do this is called the fuzzy membership function. You'll find 3 predefined (linear, sigmoidal and j-shaped) and a custom one in Idrisi.
So what could we as GI(S)ers be interested in a thing like "fuzzy logic"? Can it help us? How?
Now substitute the variable "age" in the previous example by terms like "moderate distance", "steep slope", "low elevation", "high cadmium concentration", etc. These terms show the same fuzziness such as our question for young persons.
But what's worst about all that - even if you think, you found exactly the range for, e.g., a "steep slope" - try to imagine, what means "steepness" within a soil erosion analysis? What does it mean for an architect planning the best route for a new highway segment? What does it mean to someone, who enjoys extreme skiing? What does it mean ...
Fuzzy terms like the one listed before often have quite different meanings depending on their context! Fuzziness is fuzzy itself - urghh - horrible!
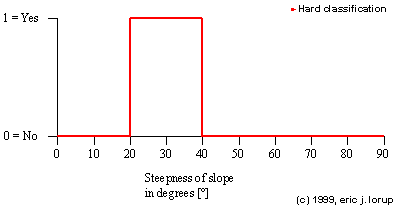
Now, how could we get around with all this? One way of course is simply introducing crisp thresholds. If necessary, a set of sharply classified ranges for each problem, where we need that: a steep slope in the context of a search for areas to serve extreme skiers could prefer slopes starting from 20° and ending at 40° (think, that's pretty steep for skiing, isn't it?). Our classification as a graph looks like this:

We are beaten by the non-satisfying fact, that - strictly following the hard classification - slopes with 19.9° or 35.1° do not belong to the steep slopes! Common sense tells us, that this cannot be the very end to this problem.
So, once again we sit down and define, what we belief as absolute thresholds for the definition of a steep slope in the context of skiing. This simple question turns out to become teasingly more and more: if we decide to even include non-extreme skiers, e. g., little children, our absolute minimum and maximum for the steepness expand to a wide range. So maybe we start at 5° as real lower threshold and go up to 60° to cover the most extreme ones among us (I know, there are some that rush down on even steeper slopes ...). These two values on the opposite of their respective scale mark the degrees, below resp. above which we cannot speak of a "steep" slope. Let's take the range chosen before (20 - 40°) as our fully agreed range of steep slope values. Now a graph could look like one of the Fuzzy classification curves in the Flash animation below.
if you don't see any image,
just an empty area, you need the Macromedia
Shockwave Flash Plugin for your browser
for an alternative, see still images for the types of membership
functions as GIFs (they will appear in one separate little browser window):
Hard
classification | Fuzzy
linear | Fuzzy
sigmoidal | Fuzzy
j-shaped | Fuzzy user-defined
| Index | ||
|---|---|---|
| Single Raster Analysis
Tools VII AUTOCORR - Spatial autocorrelation |
A-Z | Palettes and Symbol Files |
last modified: | Comments to Eric J. LORUP