Enhancement
concentrating on essentials
| Index | ||
|---|---|---|
| Image Processing III Enhancement |
A-Z | Image Processing IV (cont.) concentrating on essentials |
Assume we have enhanced our raw data. With the actual IDRISI for WINDOWS version it is unfortunately not possible to display 'real' RGB-composites. That would mean to interpret the digital numbers from three spectral bands as RGB-color codes. Thus we turn spectral properties into a visually interpretable picture: objects with very high reflectance values, e.g., in band 3 only, will appear red if the red portions are taken from this band. In consequence this allows for the display of normal, false color and arbitrary color composites. Depending on what's to classify, you'll choose the most optimal combination. A few examples from a Landsat TM 5 subscene showing the region around the Alpinforschungszentrum Rudolfsh³tte. There are 7 single bands and 4 different combinations (the spatial resolution of 120 m for band 6 - compared to 30 m for all others - makes it appear blurred):
BAND 1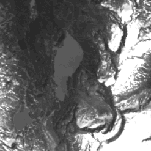 | BAND 6 | BAND 4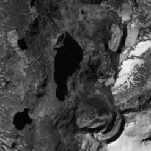 | |
BAND 2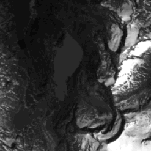 | RGB 741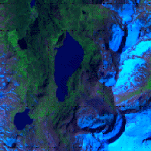 | RGB 572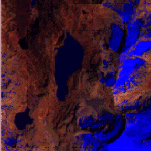 | BAND 5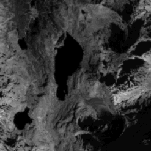 |
BAND 3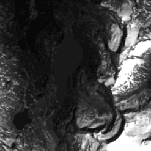 | RGB 543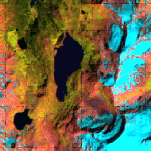 | RGB 432 | BAND 7 |
In the center of the images you notice a lake, two others are to the W resp. SW. Glaciers start in the eastern part. Spruce forests dominate the slowly declining surface in the northern part. Alpine meadow types surround the lakes.
See how different these landcover types appear in the four sample combinations!
Producing these color composites with IDRISI is a bit 'static' - it requires to compute three images (= bands) together into one. It does so by first rescaling (stretching) the digital numbers in each of the three single bands to 6 levels (0 - 5). An index is then calculated:
A pixel with the highest possible reflection (255) in all three images would compute to 215 in the color composite output image. The stretching to 6 levels means information loss! Future version of IDRISI are likely to provide real truecolor image display.
| Index | ||
|---|---|---|
| Image Processing III Enhancement |
A-Z | Image Processing IV (cont.) concentrating on essentials |