Shape analysis with PERIM and CRATIO
| Index | ||
|---|---|---|
| 1st Example | A-Z | Single Raster Analysis Tools II Shape analysis with PERIM and CRATIO |
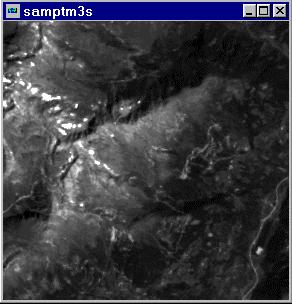
When we display the image samptm3 with the Gray 256 palette, it will be disappointing for the first moment:
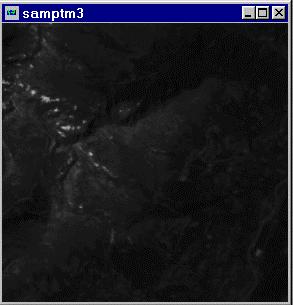
This image is a tiny clip from a Landsat TM 5 scene, band 3. To find out, if there's
more to get from it, HISTO can provide us with helpful informations. HISTO asks
for a input image - samptm3 - for which values it produces a frequency
table resp. a frequency histogram. You may define the width or number of classes
for the data range to be divided into, and you are free to set a new display minimum and/or maximum.
If you prefer a numerical output instead of a graphic, the values are output to an
editable window together with normal/cumulative frequency and proportion.
We go on with defaults (original HISTO-graphic has been altered for the purpose of display):
The x-axis shows the values ranging from choosen minimum to maximum
(here: DN, digital numbers), whereas y-axis relates to the counts of same values.
Considering the distribution of frequencies it becomes clear, why the image
appears black: for the DISPLAY IDRISI took 0 (zero) as black and 255 as white, the
values between are given gray colorcodes. But our image starts with 9 and ends
up with 182, which is considerably lower than 255. As a simple solution
the DISPLAY Launcher can be forced to perform automatic scaling - then it takes 9 as
0 (zero), 182 as 255 and rescales all other values.
Contented with this result?
OK, now take a look at the mean and the standard deviation, and consider the
'rat-tail' of cells with DNs above approx. 70. We can cut off all these values
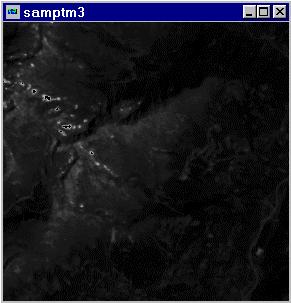
by applying STRETCH to samptm3 without loosing to much
information:
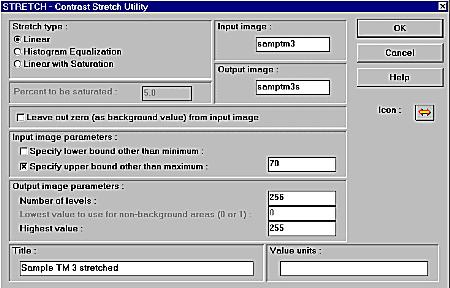
We will return to STRETCH in detail later on. Just as a short explanation: we told STRETCH to specify 70 as new maximum bound and 255 as highest value. Now 70 is equalized to 255, all higher values than 70 are set to 255 too. The stretched image shows a lot more structures now.
| Index | ||
|---|---|---|
| 1st Example | A-Z | Single Raster Analysis Tools II Shape analysis with PERIM and CRATIO |