Basic descriptive statistics with HISTO
Using FILTER
| Index | ||
|---|---|---|
| Single Raster Analysis Tools I Basic descriptive statistics with HISTO |
A-Z | Single Raster Analysis Tools III Using FILTER |
Many shape descriptors have been introduced for different purposes. E.g. to assist pattern recognition techniques in image processing, or make the approach to explain function and/or genesis by form (classification of certain geomorphological elements, ...).
If you are interested in pattern analysis, take a look at FRAGSTATS - a free software package available from ftp.orst.edu. It calculates more than 90 indicative parameters for quantifying landscape structure. BTW, IDRISI has implemented a module - PATTERN - which computes a handful of these parameters. They are well documented and referenced in the on-line help facility.
The thinness ratio is defined as ![]() , where
A means the area and P the perimeter. By this formula
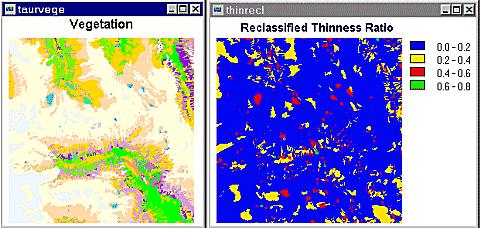
we simply relate the area of a polygon to its perimeter. Again we will apply this method to the vegetation image (had no better dataset at
hand :-)
, where
A means the area and P the perimeter. By this formula
we simply relate the area of a polygon to its perimeter. Again we will apply this method to the vegetation image (had no better dataset at
hand :-)
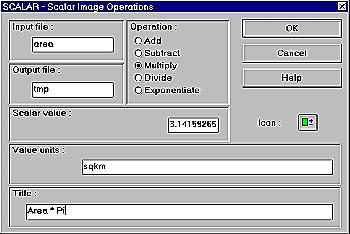
The PERIM output is raised to the power of 2 again with SCALAR.
To make the result clearer, I used a RECLASSification to 4 classes. The highest ratio is 0.785 for a single pixel. The blue color indicates a high grade of thinness whereas the tiny green spots show the opposite - compactness. The results strongly depend on scale and resolution. In a later part of the tutorial we will overlay the vegetation with the thinness ratio image to find out possible coincidences.
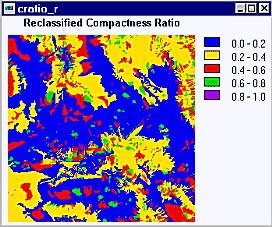
 , AP means the
area of the polygon and AC the area of a circle having the
same perimeter as that of the polygon. The 'most compact polygon' (one pixel) has a
theoretical compactness ratio of 0.886, so the reclassified images shows 5 classes. Higher
values indicate more compact areas.
, AP means the
area of the polygon and AC the area of a circle having the
same perimeter as that of the polygon. The 'most compact polygon' (one pixel) has a
theoretical compactness ratio of 0.886, so the reclassified images shows 5 classes. Higher
values indicate more compact areas.
| Index | ||
|---|---|---|
| Single Raster Analysis Tools I Basic descriptive statistics with HISTO |
A-Z | Single Raster Analysis Tools III Using FILTER |