Shape analysis with PERIM and CRATIO
Computing Slope and Aspect with SURFACE
| Index | ||
|---|---|---|
| Single Raster Analysis Tools II Shape analysis with PERIM and CRATIO |
A-Z | Single Raster Analysis Tools IV Computing Slope and Aspect with SURFACE |
FILTER appears in the Analysis/Context and in the Analysis/Image Processing menues. It can be applied to a variety of different tasks. You may find the names convolution, roving window or filtering too for its functions. Within the concept of Cartographic Modeling, established by D. TOMLIN*, the module refers to the family of Focal Operators.
FILTER accepts an input image and computes the output image cells as a function of their neighbourhood. In IDRISI, neighbourhood is defined by a 3x3 cells kernel (window) focusing on the center cell. To get an idea of how that works, imagine this kernel 'roving' over the input raster cell by cell. Now the focus pixel and its 8 neighbours are multiplied by the values stored in the kernel, then summed up and the result is written to the corresponding pixel in the output image:
FILTER provides several ready-made filter kernel functions (the numbers relate to a simple 3x3 filter kernel size):
In IfW 2 the user may define own filters of various sizes (but restricted to a rectangular shape). The Filter editor provides a user-friendly interface for the creation of these filters. Filter definitions can be saved too.
You may have to deal with images, that are 'noisy' for one or another reason - more often you will be concerned with that during image processing, e.g. generalizing raw classifications. But there will be cases in GIS, where it is appropriate to apply a low pass filter, achieving somewhat 'smoothed' results. Interpolated DEMs are a common example. The choice of filter type strongly depends on the nature of your data
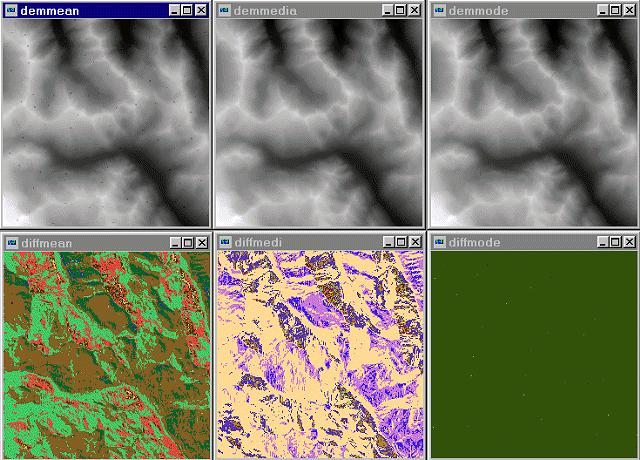
Let us treat a DEM with FILTER. It shows undesired artifacts generated through the joining of two DEMs from different sources. There are random pixels with a value of 0 (zero) scattered all over the DEM. How could we remove them? There is more than just one way.
- a mean filter would certainly not yield to satisfying results, as the range
within the 3x3 kernel around the erroneous pixels is much too high. Use mean filters e.g.
to smooth DEMs.
- the median filter is said to remove noise from images properly - examine the
graphic representation of the difference images too.
- a mode filter seems to be the best choice for our problem.
The graphic below shows a mean, median and mode filtered noisy DEM (hope you will recognize the tiny dots). diffmean, diffmedi and diffmode are difference images (noisy DEM minus filtered outputs - done with OVERLAY) to check, what has been filtered out. diffmode contains of the noise pixels itself:
As stated above smoothing is applied to images with 'noisy' appearance, but what if noise is not distributed homogeneously over the image? A DEM might show a few erroneous pixels like shooting holes in some part of the image. So it is not your intention to smooth the whole image and thus loose information unnecessarily.
In such a case the Adaptive Box filter would be a good choice: you give two threshold values - one for the local standard deviation (computed from the values within the 3x3, 5x5 or 7x7 roving kernel window) and one as the acceptable difference between the focussed cell and the mean of the neighbours. Furthermore you decide about the action to take for the case of both standard deviation and difference thresholds being exceeded (replacing such pixels by zero or by local average). All other pixels are left original. By that only highly variant values will be matched.
Distinguish between FILTER kernels, that enhance and those
that detect and 'extract' areas of sudden change. The former have roving window
values that sum up to 1, so in case of 9 similar values in a raster there will occur no
change in the output. If at least one value differs from the others, this 'contrast' gets enhanced.
Edge detect filters (high pass) sum up to 0 (zero), so cells surrounded by neighbours with
the same values are set to 0 (zero):
Especially the high pass filter detects some irregularities in the DEM, that did not appear in the original. The DEM has been pieced together from different sources and we just found a seam!
The module TEXTURE (since IfW 2) has the ability to do Edge analysis by applying 3x3 directional filter kernels to the input image. It will output up to 8 images (N, NE, E, SE, S, SW, W and NW).
The NE-SW detecting filter enlightens (= high values) NE-SW ridges (streamlines, ...), black appearances (= low and negative values) indicate the diametrical diagonals.
C. Dana TOMLIN, 1990: Geographic Information Systems and Cartographic Modeling. Prentice-Hall, Englewood Cliffs
| Index | ||
|---|---|---|
| Single Raster Analysis Tools II Shape analysis with PERIM and CRATIO |
A-Z | Single Raster Analysis Tools IV Computing Slope and Aspect with SURFACE |
last modified: | Comments to Eric J. LORUP