Using FILTER
QUADRAT, CENTER - Point Pattern Analysis
| Index | ||
|---|---|---|
| Single Raster Analysis Tools III Using FILTER |
A-Z | Single Raster Analysis Tools V QUADRAT, CENTER - Point Pattern Analysis |
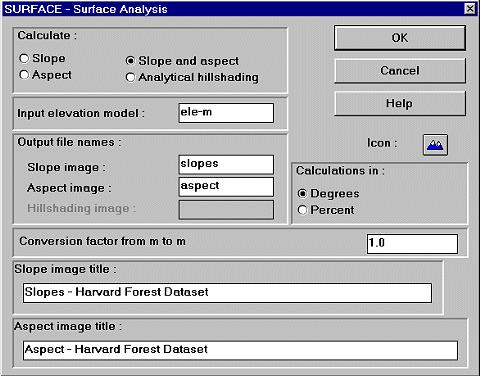
The SURFACE module can derive three surficial characteristics:
 In terms of IDRISI
the values in a slope image reflect the maximum slope around each pixel among
four directions - N, W, E, S. Only these 4 neighbours are taken into account.
Be critical of what you get 'at your fingertips', calculations of slope
aren't that clear-cut they may seem to be (background reading e.g. BERRY 1993,
p. 147ff.
*). Be prepared to receive considerably - in terms of
reliability - different results throughout GIS software products treating one and the same dataset.
Disturbing, isn't it?
In terms of IDRISI
the values in a slope image reflect the maximum slope around each pixel among
four directions - N, W, E, S. Only these 4 neighbours are taken into account.
Be critical of what you get 'at your fingertips', calculations of slope
aren't that clear-cut they may seem to be (background reading e.g. BERRY 1993,
p. 147ff.
*). Be prepared to receive considerably - in terms of
reliability - different results throughout GIS software products treating one and the same dataset.
Disturbing, isn't it?
Slopes may either be expressed as decimal degrees (0 - 90°) - ![]() - or percent (45° equals to 100%, whereas 90° slopes
approach to infinity) -
- or percent (45° equals to 100%, whereas 90° slopes
approach to infinity) - ![]() -
in the SURFACE module. Slope images may be used to derive constraint areas, e.g. for planning
factories, roads, ... they are part of predicting soilerosions, or danger of avalanches and so on.
Keep in mind that slope computing is by no means strictly restricted to DEM datasets.
-
in the SURFACE module. Slope images may be used to derive constraint areas, e.g. for planning
factories, roads, ... they are part of predicting soilerosions, or danger of avalanches and so on.
Keep in mind that slope computing is by no means strictly restricted to DEM datasets.
Let us now proceed to the aspect images. IDRISIs SURFACE module calculates them as
'the direction in which the maximum slope faces'. The values are decimal degrees of type real that
range between 0° and 360° (N). The direction is clockwise (90° means east, 180° south, ...). Values
of -1 are assigned to completely flat areas (where slopes are 0).
Last but not least we may simulate the state of illumination for a DEM at given sun azimuth (260 - 290°)
resp. elevation angle (0 - 90°). As with the ORTHO-module before we could
apply TRANSPOS to the DEM, rotate it, run the analytical hillshading and rotate the resulting
image back to the origin, thus simulating light sources from any direction. The algorithmic basis of
the analytical hillshading is a simple combination of trigonometrical calculations with slope, aspect and
the zenith angle. Hillshade images are intended only for visualizations (e.g. enhancing textural and
directional elements). Values range from 0 to 1 so a STRETCHing to 0 - 255 may be expedient.
Notice, that cast shadow is not taken into account!
The following graphic is the 3D-representation of a hillshade draped over the raw DEM. Rivers, lakes
and glaciers have been added subsequently in a prevoius step. The blue sky was a little bit tricky but
has been realized completely with IDRISI:
| Index | ||
|---|---|---|
| Single Raster Analysis Tools III Using FILTER |
A-Z | Single Raster Analysis Tools V QUADRAT, CENTER - Point Pattern Analysis |