| Index | ||
|---|---|---|
| GIS Issues | A-Z | 1st Example |
IDRISI is a raster-based program, so displaying images is essential for evaluating your raw data as well as intermediate products or final results by eye. Call the DISPLAY Launcher or simply press F5:

Decide which type to display - Image, Vector or Map composition file - and the
dialog box presents you the appropriate fields. By default one gets into the image option.
Now doubleclick (or rightbutton-click) the 'Name of file to display'-field. A Pick File
list shows you all imagefile names in your working directory (remember ENVIRON) to select one.
The Expansion factor determines the size of your display window. IDRISI defaults to
a value depending on the physical image size - if the raster is rather small, say 10 cols
x 10 rows, you'll get an expansion factor of 64. If you like to compare many images
visually, adjust that factor to your needs.
By electing a palette from the Palette options you tell IDRISI how to relate the
values in the image to colors. Take one out of the already prepared or name your own
palette file (visit the section about Palette files to
learn more about structure, creating and handling). How IDRISI performs this relation,
depends on the nature of the values: IDRISI provides you with up to 256 colors. For images
with integer values ranging between 0 and 255 (byte range), IDRISI classes that value with
the corresponding color code. Images holding values that extend the 0 to 255 range or
those with floating point values have to be autoscaled. IDRISI checks for the minimum and
maximum values, takes them as 0 resp. 255 and recalculates all the other values between as
byte numbers. That's done automatically in the mentioned cases but you can force it with
byte images too by clicking Autoscale image for display.
The option in the bottom part, Map components, allow you to addon descriptive
elements to your map. IDRISI lets you arrange that later too.
Using the image taurvege with a palette also named taurvege:
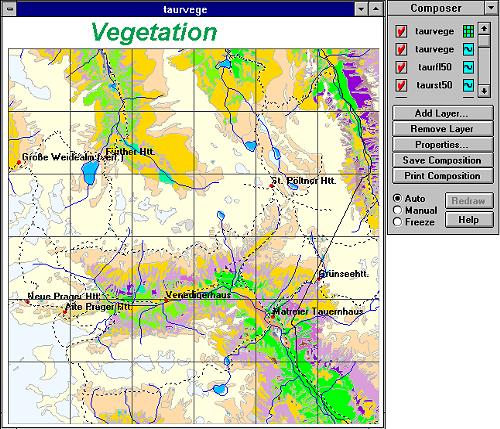 Once you open a display, IDRISI opens a accompanying Composer dialogbox, that
allows for adding/removing vector layers, modifying map components, saving and printing,
thus preparing what IDRISI calls a Map Composition. Up to 16 layers can be stacked
that way. One image is allowed per composition, for more use OVERLAY techniques
instead. Several images side by side have to be concatenated first with CONCAT.
Once you open a display, IDRISI opens a accompanying Composer dialogbox, that
allows for adding/removing vector layers, modifying map components, saving and printing,
thus preparing what IDRISI calls a Map Composition. Up to 16 layers can be stacked
that way. One image is allowed per composition, for more use OVERLAY techniques
instead. Several images side by side have to be concatenated first with CONCAT.
If you open a second display the name in the composer menu (eg. taurvege) changes to the
active display window. Little icons right to the layer names tell you about the layer
type. By drag and drop with that names in the composer you can alter the stack sequence.
The square boxes left to the names indicate visibility. Checked means? Right - visible!
When working with bigger images (or slower CPU-speeds) it may be opportune to deactivate
the Auto Redraw feature, because - well at least now at time of writing this text -
display speed, especially with larger vector overlays isn't that heady.
The displayed image corresponds to a spatial database and with some simple tools you
can query it interactively. If the cursor is moved over the image, column-/ row-number and
the x- and y-coordinates are shown in the statusbar. To query the values, apply the
Cursor inquiry mode, which must be activated from the toolbar ![]() . The cursor changes
to a crosshair, and by clicking into the image IDRISI writes the cellvalues to the middle
of the statusbar.
. The cursor changes
to a crosshair, and by clicking into the image IDRISI writes the cellvalues to the middle
of the statusbar.
Since IfW 2 you have more control and more functions when displaying images. A very useful utility is the Extended cursor inquiry mode (Display/Display Preferences), which allows to inquire several images at the same time. Take for example the visual analysis of a Landsat image, where you like to know the digital number (spectral reflectance value) for one specified pixel. So put (1) together a so-called Image group file from within the EDIT module. The Group file editor (2) is a comfortable tool to make this file. Simply choose those image files you would like to query. Save and tell IDRISI in the Display preferences (3) to load this newly created Image group file for the extended cursur inquiry.
 As soon as you
query a member of the activated image group file from the display, an additional
information window pops up showing the values for the pixel under consideration in all the
images you put in the group file before.
As soon as you
query a member of the activated image group file from the display, an additional
information window pops up showing the values for the pixel under consideration in all the
images you put in the group file before.
Another nice feature of DISPLAY is the Interactive legend highlighting:
whenever you like to know the spatial distribution of all the pixels belonging to one
class (showing the same cellvalue resp. attribute ID) display the legend too, then press
down the shift button and left-mouseclick on the legend entry box of the value you are
interested in - all pixels with that cellvalue will turn into their complementary color
and thus flash. If you do the same but right-mouseclick, you call up Interactive
legend editing.
can be a valuable completion to 2-dimensional bird's-eye view. View direction and view angle can be adjusted between 0 - 90°. Together with the TRANSPOSE module (calculates rotated images) IDRISI can produce looks from/to nearly any direction. It allows for one byte image to be draped over the surface (normally but not compelling a DEM) and the choice of a palette:
As you may have noticed from the first figure on this page, there are now (since IfW 2) more tools to visualize your raster data: Media Viewer, SEPARATE and ILLUMINATE.
The Media Viewer creates AVIs (Video for WINDOWS files) from a sequence of images (e. g., from a Image group file).
SEPARATE takes a input image + a palette file and separates the input files values into three images (red, green and blue) depending on the specified palette file.
ILLUMINATE may be used to merge panchromatic SPOT with multispectral LANDSAT TM images, also for the merging of hillshade images with spectral data. Idrisi help provides step-by-step instructions how to do this.
| Index | ||
|---|---|---|
| GIS Issues | A-Z | 1st Example |
last modified: | Comments to Eric J. LORUP